Haven't installed OpenClaw yet? Click here for one-line install commands
curl -fsSL https://openclaw.ai/install.sh | bashiwr -useb https://openclaw.ai/install.ps1 | iexcurl -fsSL https://openclaw.ai/install.cmd -o install.cmd && install.cmd && del install.cmd- OpenClaw offers three operation interfaces -- CLI, Gateway Dashboard Web UI, and third-party Channels -- among which the Gateway Dashboard is the official built-in graphical management panel, usable without any additional installation[1]
- The Dashboard Web UI runs by default at
http://127.0.0.1:18789, providing four core functions: Agent management, conversation history, Channel status, and system resource monitoring[8] - Control UI settings (
gateway.auth.token,allowedOrigins) are critical security mechanisms for protecting the Web UI from unauthorized access[4][5] - Through Tailscale, SSH Tunnel, or Cloudflare Tunnel, even non-engineers can securely access the remote Dashboard from any device without understanding complex network configurations[10]
- Combined with third-party GUI solutions like OpenWebUI or desktop Shell integrations, OpenClaw can provide enterprises with a graphical operation experience approaching commercial SaaS products[9]
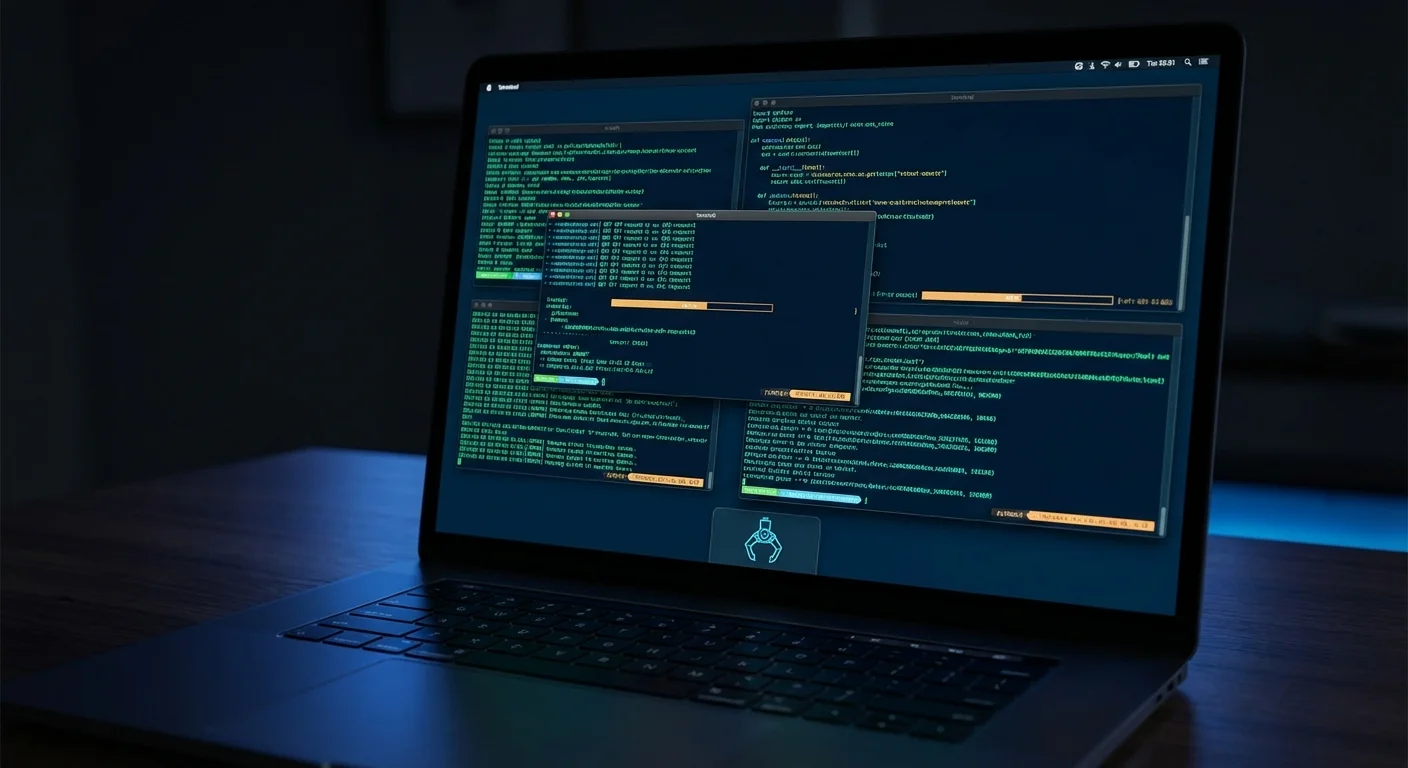
When people think of AI agent tools, the first image that comes to mind is often a black terminal screen with white text -- typing commands, waiting for responses, then typing the next command. For developers comfortable with the command line, CLI is an efficient and intuitive operation method; but for team members in marketing, sales, project management, and other non-technical roles, this barrier is enough to make them shy away from OpenClaw.[6]
In fact, OpenClaw has built-in graphical operation capabilities from its architectural design. The Gateway service is not only the core hub for WebSocket communication but also provides a fully featured Web Dashboard on the same port. Simply open a browser, enter http://127.0.0.1:18789, and you can manage agents, view conversation history, and monitor system status in a visual way -- without typing a single CLI command.[1]
This article systematically introduces the Gateway Dashboard Web UI's complete features, Control UI security settings, remote access solutions, third-party GUI integrations, desktop shortcuts, and enterprise best practices, starting from OpenClaw's three operation modes. Whether you're a non-engineer encountering OpenClaw for the first time, or a technical lead planning graphical deployment for your team, you'll find the technical references you need in this guide.
I. OpenClaw's Three Operation Modes
Before diving into the Web UI, let's clarify the three operation interfaces OpenClaw provides. These three are not mutually exclusive alternatives but complementary choices for different scenarios.[2]
| Operation Mode | Interface Type | Target Users | Real-Time Interaction | Task Management | Remote Access |
|---|---|---|---|---|---|
| CLI | Terminal command line | Developers, DevOps | Real-time conversation | Basic (manual queries) | Via SSH |
| Gateway Dashboard Web UI | Browser graphical interface | All team members | Real-time conversation + visualization | Complete (Dashboard panels) | Tailscale / Tunnel |
| Channel (Telegram / Slack / API) | Messaging platform integration | Mobile, automation | Asynchronous messaging | Limited (varies by Channel) | Natively supported |
1.1 CLI: The Developer's First Choice
CLI is OpenClaw's most fundamental and powerful operation method. All advanced features -- including Gateway management, configuration changes, and Node scheduling -- can be completed via CLI. For users comfortable with the terminal, CLI offers the fastest operation speed and maximum flexibility.[2]
1.2 Gateway Dashboard Web UI: Visual Management
The Dashboard is a browser interface built into the Gateway, providing Agent management, conversation records, Channel monitoring, and system resource dashboards. Its greatest advantage is zero installation -- as long as the Gateway is running, the Web UI is automatically available.[1]
1.3 Channels: Access from Anywhere
Channels are OpenClaw's integration interface with external communication platforms (Telegram, Slack, Discord, LINE, etc.). They let you interact directly with AI agents from your preferred chat tools, ideal for mobile devices and asynchronous workflows.[9]
All three modes can run simultaneously. You can use CLI in the terminal to adjust settings, monitor agent status in the browser's Dashboard, and trigger tasks from your phone via Telegram Bot at any time -- all operations ultimately converge on the same Gateway.
II. Gateway Dashboard Web UI
The Gateway Dashboard is OpenClaw's built-in graphical management panel, launched alongside the Gateway service. It provides a full single-page application (SPA) on the Gateway's HTTP endpoint, covering all the features needed for daily operations.[1][8]
2.1 Starting and Accessing
If the Gateway is already running (in most cases it starts automatically after installation), simply open a browser and navigate to the default address:
# Confirm Gateway is running
openclaw gateway status

# Open Dashboard in browser
# Default address: http://127.0.0.1:18789

# Or use the CLI shortcut to open browser directly
openclaw dashboard
The openclaw dashboard command automatically detects the operating system and calls the corresponding browser launch command (macOS uses open, Linux uses xdg-open, Windows uses start).[8]
2.2 Dashboard's Four Core Areas
The Dashboard's interface uses a classic SPA layout with left navigation and right content area, containing four main functional areas:
- Overview: Real-time summary of Gateway running status, connected Node count, active Agent count, and system resource usage
- Agents: List of all created Agents, including each Agent's model settings, Skill configuration, conversation history, and task execution records
- Channels: Status of all configured communication Channels, including connection health, message throughput, and error logs
- Logs: Real-time log streaming for Gateway and Nodes, with filtering, search, and time range queries
III. Dashboard Feature Details
Below is a detailed breakdown of each Dashboard functional area's operations and practical value.[1]
3.1 Agent Management
The Agent management page is the Dashboard's core feature. Here you can create new Agents, modify existing Agent settings, and view each Agent's execution history.
Creating a New Agent: Click the "New Agent" button in the upper right corner, enter the Agent name, select a model, check the allowed Skills, and the Agent is created. This is equivalent to the CLI command openclaw agent create.
Modifying Agent Settings: Click on an Agent name to enter its detail page, where you can directly modify the model (Primary / Fallback), system prompt, max Token limit, temperature, and other parameters. All changes take effect immediately without restarting the Gateway.
# CLI equivalent operations (for reference)
openclaw agent create --name "research-bot" \
--model claude-opus-4-6 \
--skills browser,shell,file

openclaw agent config research-bot \
--system-prompt "You are a research assistant..."
--temperature 0.3
--max-tokens 8192
Conversation Visualization: The Dashboard displays each Agent's conversation history in a chat-like interface. You can see the complete context flow -- user input, Agent's reasoning process, tool calls, and final response. This is particularly valuable in debugging and educational scenarios: non-technical team members can intuitively understand "how the AI agent thinks."
3.2 Conversation Records and Workspace
Each Agent's conversation records are organized by Workspace. The Dashboard's Workspace management interface lets you:
- Browse historical conversations: Browse all past Agent conversations in timeline format, search by specific keywords or time ranges
- Export conversation records: Export complete conversations in JSON or Markdown format for documentation archiving or team sharing
- Clean up expired data: Set automatic cleanup policies, or manually delete Workspaces no longer needed to free disk space
- Branch conversations: Create a branch (Fork) from any point in a historical conversation to explore different task paths without affecting the original record
3.3 Channel Status Monitoring
If you've already configured a Telegram Bot, Slack App, or other Channel for OpenClaw, the Dashboard's Channel page shows real-time status for each channel.[9]
- Connection health: Green / yellow / red indicator lights showing each Channel's connection status
- Message statistics: Message send/receive counts in the past 24 hours, average response latency, error rate
- Error logs: Detailed records of anomalous events like Channel disconnections, API authentication failures
- Quick reconnect: For disconnected Channels, directly click the "Reconnect" button to attempt re-establishing the connection
3.4 System Resource Monitoring
The Dashboard's Overview page includes a real-time system resource monitoring panel, letting you track running conditions without SSH-ing to the server:
- CPU and memory usage: Line charts showing resource usage trends over the past 1 hour / 24 hours / 7 days
- Gateway connections: Current number of Nodes connected to the Gateway, client count, and total WebSocket connections
- Task queue depth: Number of tasks waiting for execution, helping you determine if more Nodes are needed to improve throughput
- LLM API usage: API call counts, Token consumption, and estimated costs per model provider
# CLI equivalent operations
openclaw gateway status --deep
openclaw gateway status --json
IV. Control UI Settings
The Gateway Dashboard is accessible only locally (127.0.0.1) by default, but once you set the Gateway to Remote mode or expose it externally through a tunnel, you must enable Control UI security mechanisms.[4][5]
4.1 gateway.auth.token
Dashboard access authentication shares the same Token as Gateway WebSocket authentication. When you open the Dashboard in a browser, the system requires you to enter the Gateway Token before accessing the management interface.
# Generate or update Gateway Token
openclaw doctor --generate-gateway-token

# Token format: ogt_ prefix + 32 character random string
# Example: ogt_a1b2c3d4e5f6g7h8i9j0k1l2m3n4o5p6

# Location in openclaw.json
{
  "gateway": {
    "auth": {
      "token": "ogt_a1b2c3d4e5f6g7h8i9j0k1l2m3n4o5p6",
      "dashboard_enabled": true,
      "session_timeout_minutes": 480
    }
  }
}
If you're using Local mode without a Token configured, the Dashboard will skip authentication and directly show the management interface. However, as long as remote access is involved, a Token is a mandatory security measure.[5]
4.2 allowedOrigins
The allowedOrigins setting controls which domain origins' browser requests can access the Dashboard. This is an important defense against cross-site request forgery (CSRF) attacks.
# Set allowed origin domains
openclaw config set gateway.allowed_origins \
'["https://gateway.yourdomain.com", "https://admin.yourdomain.com"]'

# Complete structure in openclaw.json
{
  "gateway": {
    "allowed_origins": [
      "https://gateway.yourdomain.com",
      "https://admin.yourdomain.com"
    ],
    "cors": {
      "enabled": true,
      "allow_credentials": true,
      "max_age": 86400
    }
  }
}
If you access the Dashboard through a reverse proxy (Nginx / Caddy), the domains in allowedOrigins must match what users see in the browser address bar. Otherwise, the browser will block all API requests due to CORS restrictions.[4]
4.3 Dashboard Display Options
You can further customize the Dashboard's display behavior:
# Disable Dashboard (keep only WebSocket and REST API)
openclaw config set gateway.auth.dashboard_enabled false

# Set auto-logout time (default 480 minutes = 8 hours)
openclaw config set gateway.auth.session_timeout_minutes 60

# Enable read-only mode (view only, cannot modify settings)
openclaw config set gateway.auth.dashboard_readonly true

# Hide specific functional areas (e.g., prevent non-admins from seeing logs)
openclaw config set gateway.auth.dashboard_sections \
'["overview", "agents", "channels"]'
V. Remote Access to Web UI
The Dashboard's greatest value is realized in remote scenarios. When the OpenClaw Gateway is deployed on a cloud server or office workstation, you need a secure way to access the Dashboard from external devices. Here are three mainstream approaches.[10]
5.1 Tailscale (Recommended)
Tailscale is a zero-configuration WireGuard VPN that creates encrypted tunnels between all devices. It's the best solution for accessing a remote Dashboard -- no need to open any ports, configure DNS, or manage TLS certificates.
# Step 1: Install Tailscale on the Gateway server
curl -fsSL https://tailscale.com/install.sh | sh
sudo tailscale up

# Step 2: Confirm Tailscale IP
tailscale ip -4
# e.g., 100.64.0.1

# Step 3: Install Tailscale on client devices too
# macOS / Windows / iOS / Android all supported
sudo tailscale up

# Step 4: Access directly from client browser
# http://100.64.0.1:18789
# Or use MagicDNS:
# http://my-server.tailnet-name.ts.net:18789
Tailscale's free plan supports up to 100 devices, which is sufficient for most individuals and small teams.[10]
5.2 SSH Tunnel
If you already have SSH access to the Gateway server, the simplest approach is to create an SSH tunnel that forwards the remote Dashboard port to your local machine:
# Run on your laptop
ssh -L 18789:127.0.0.1:18789 user@your-server-ip

# Keep the SSH connection open, then open in local browser:
# http://127.0.0.1:18789

# Use -N and -f parameters to run in background
ssh -fNL 18789:127.0.0.1:18789 user@your-server-ip

# To close when needed
# macOS/Linux:
kill $(lsof -t -i :18789 -sTCP:LISTEN)
# Or:
ps aux | grep "ssh -fNL" | grep -v grep | awk '{print $2}' | xargs kill
SSH Tunnel's advantage is that no additional software installation is required, but each connection needs manual tunnel establishment, and it's prone to disconnection in unstable network environments. You can pair it with autossh for automatic reconnection.
5.3 Cloudflare Tunnel
For scenarios requiring stable and persistent remote access, Cloudflare Tunnel (formerly Argo Tunnel) provides an enterprise-grade solution. It creates an encrypted tunnel between the Gateway server and Cloudflare's edge, allowing you to access the Dashboard through a custom domain while enjoying Cloudflare's DDoS protection and Zero Trust access control.
# Step 1: Install cloudflared
# macOS
brew install cloudflared
# Linux
curl -fsSL https://github.com/cloudflare/cloudflared/releases/latest/download/cloudflared-linux-amd64 \
-o /usr/local/bin/cloudflared && chmod +x /usr/local/bin/cloudflared

# Step 2: Authenticate and create Tunnel
cloudflared tunnel login
cloudflared tunnel create openclaw-dashboard

# Step 3: Configure Tunnel routing
# ~/.cloudflared/config.yml
tunnel: <your-tunnel-id>
credentials-file: /root/.cloudflared/<your-tunnel-id>.json

ingress:
  - hostname: dashboard.yourdomain.com
    service: http://127.0.0.1:18789
  - service: http_status:404

# Step 4: Set DNS and start
cloudflared tunnel route dns openclaw-dashboard dashboard.yourdomain.com
cloudflared tunnel run openclaw-dashboard

# Step 5: Configure access policies in Cloudflare Zero Trust
# Allow only specific email addresses to access Dashboard
Cloudflare Tunnel's free plan has no traffic limits. Combined with Zero Trust's Email OTP authentication, non-technical team members can securely access the Dashboard through simple email verification -- no VPN client or SSH keys needed.
VI. Third-Party GUI Solutions
If the Gateway Dashboard's functionality doesn't meet specific needs, OpenClaw's open architecture allows you to connect third-party GUI frontends or build custom interfaces.[3]
6.1 OpenWebUI Integration
OpenWebUI is a popular open-source chat interface project, originally designed for Ollama and OpenAI-compatible APIs. Since the OpenClaw Gateway also provides an OpenAI-compatible REST API endpoint, you can point OpenWebUI at the Gateway for a richer chat experience.
# Launch OpenWebUI with Docker, pointing to OpenClaw Gateway
docker run -d \
--name openwebui \
-p 3000:8080 \
-e OPENAI_API_BASE_URL=http://host.docker.internal:18789/v1 \
-e OPENAI_API_KEY=ogt_your_gateway_token \
-v open-webui:/app/backend/data \
ghcr.io/open-webui/open-webui:main

# Open http://localhost:3000 in browser
# OpenWebUI will forward requests to OpenClaw Gateway
OpenWebUI provides features that the Dashboard doesn't, such as Markdown preview, code syntax highlighting, file upload, conversation share links, and more -- suitable for scenarios requiring a rich chat experience.
6.2 Building a Custom Frontend
OpenClaw Gateway's REST API and WebSocket API are fully documented, allowing you to build a custom management interface using any frontend framework (React, Vue, Svelte, etc.).
# Gateway REST API examples

# Get all Agent list
curl -H "Authorization: Bearer ogt_your_token" \
http://127.0.0.1:18789/api/agents

# Get a specific Agent's conversation history
curl -H "Authorization: Bearer ogt_your_token" \
http://127.0.0.1:18789/api/agents/research-bot/conversations

# Send a message to an Agent (REST method)
curl -X POST \
-H "Authorization: Bearer ogt_your_token" \
-H "Content-Type: application/json" \
-d '{"message": "Help me search for the latest AI safety research papers"}' \
http://127.0.0.1:18789/api/agents/research-bot/chat

# WebSocket real-time conversation
# ws://127.0.0.1:18789/ws?token=ogt_your_token
Typical scenarios for building custom frontends include: embedding OpenClaw agents into enterprise internal platforms, building specialized interfaces for vertical domains, or integrating into existing IT monitoring dashboards.[3]
VII. Desktop Integration Tips
Beyond the Web UI in browsers, OpenClaw also has convenient integration methods on various operating systems' desktops, making your daily operations smoother.
7.1 macOS Integration
# Add openclaw to PATH (usually done automatically during installation)
export PATH="$HOME/.openclaw/bin:$PATH"

# Create a Spotlight-searchable app shortcut
cat <<'EOF' > /tmp/OpenClaw-Dashboard.command
#!/bin/bash
open "http://127.0.0.1:18789"
EOF
chmod +x /tmp/OpenClaw-Dashboard.command
mv /tmp/OpenClaw-Dashboard.command ~/Applications/

# Alfred / Raycast shortcut
# Create a Workflow, keyword input "oc" to:
# 1. Start Gateway (if not running)
# 2. Open Dashboard

# System tray integration (macOS native support)
# After Gateway starts, a crab icon appears in the menu bar
# Click the icon for quick access to:
#   - Open Dashboard
#   - View Gateway status
#   - Start / Stop Gateway
#   - Recent Agent conversations
7.2 Windows Integration
# PowerShell Profile shortcut functions
# Add to $PROFILE (usually at ~\Documents\PowerShell\Microsoft.PowerShell_profile.ps1)

function oc-dash { Start-Process "http://127.0.0.1:18789" }
function oc-status { openclaw gateway status }
function oc-tui { openclaw tui $args }

# Windows Terminal custom profile
# Add an OpenClaw-dedicated Profile in settings.json:
{
  "name": "OpenClaw",
  "commandline": "openclaw tui",
  "icon": "%USERPROFILE%\\.openclaw\\icon.png",
  "startingDirectory": "%USERPROFILE%",
  "colorScheme": "One Half Dark"
}

# Taskbar shortcut
# Right-click Desktop > New > Shortcut
# Target: cmd /c start http://127.0.0.1:18789
# Name: OpenClaw Dashboard
7.3 Linux Integration
# GNOME / KDE desktop shortcut
cat <<EOF > ~/.local/share/applications/openclaw-dashboard.desktop
[Desktop Entry]
Name=OpenClaw Dashboard
Comment=OpenClaw Agent Management Dashboard
Exec=xdg-open http://127.0.0.1:18789
Icon=web-browser
Type=Application
Categories=Development;Utility;
EOF

# i3 / Sway keyboard shortcut
# Add to ~/.config/i3/config:
bindsym $mod+Shift+o exec xdg-open http://127.0.0.1:18789

# Shell Alias (bash / zsh)
echo 'alias ocd="openclaw dashboard"' >> ~/.bashrc
echo 'alias ocs="openclaw gateway status"' >> ~/.bashrc
echo 'alias occ="openclaw tui"' >> ~/.bashrc
VIII. Enterprise Scenarios: How Non-Engineers Use OpenClaw
OpenClaw's graphical interface design isn't just about "looking good" -- it's about extending AI agent capabilities to the entire organization, including marketing, sales, HR, finance, and other departments unfamiliar with the command line.[6][7]
8.1 Deployment Architecture Recommendations
A typical enterprise deployment architecture:
# Enterprise deployment architecture
[Marketing Team - Browser]  ──┐
[Sales Team - Browser]      ──┼── Cloudflare Zero Trust ── [Nginx] ── [Gateway :18789]
[PM Team - Browser]         ──┘                                          |
                                                         ┌────────┼────────┐
                                                      [Node 1]  [Node 2]  [Node 3]
                                                   (Research   (Content  (Data
                                                    Agent)      Agent)    Agent)
Key design principles of this architecture:
- Cloudflare Zero Trust: Authenticates via corporate email or SSO; non-technical users don't need VPN or SSH keys
- Role separation: Dashboard's read-only mode lets non-admins only use Agent conversation features, not modify system settings
- Multi-Node deployment: Different department agents run on independent Nodes without mutual interference
8.2 Setting Up Workflows for Non-Engineers
Here's the standard flow for getting non-engineers up and running quickly:
- IT department deploys the Gateway and configures Cloudflare Tunnel + Zero Trust
- IT department creates dedicated Agents (e.g., "Marketing Content Assistant"), pre-configured with system prompts and Skill permissions
- Users receive a URL (e.g.,
https://ai.company.com) and operating instructions - Users complete OTP verification with their corporate email and enter the Dashboard
- Users enter requests directly in the Agent conversation area, as naturally as using ChatGPT
Throughout this process, users don't need to install any software, understand terminal commands, or know the technical details of Gateway or Nodes. For them, OpenClaw is simply "a ChatGPT that can do more things."
8.3 Common Enterprise Use Cases
| Department | Agent Name | Typical Tasks | Skills Used |
|---|---|---|---|
| Marketing | content-writer | Social media post writing, SEO copy generation | browser, file |
| Sales | lead-researcher | Prospect research, competitive analysis | browser |
| HR | hr-assistant | Job description writing, interview question generation | file |
| Finance | report-analyzer | Financial report summaries, data trend analysis | file, shell |
| PM | spec-drafter | Requirements document writing, technical spec compilation | browser, file |
IX. Security Best Practices
Exposing the Dashboard externally means OpenClaw's management interface is exposed to a broader attack surface. The following security measures are baseline requirements for production environments.[5]
9.1 Token Management
- Strength requirements: Tokens generated by
openclaw doctor --generate-gateway-tokendefault to 32-character random strings with sufficient strength. Never substitute simple passwords - Regular rotation: Rotate Tokens every 90 days, and immediately upon team member changes
- Secure storage: Tokens should never appear in Git repositories, chat logs, or emails. Use environment variables or password management tools for transmission
# Rotate Token (old Token immediately invalidated)
openclaw doctor --generate-gateway-token --force

# Manage Token via environment variable
export OPENCLAW_GATEWAY_TOKEN=ogt_new_token_here
openclaw gateway restart

# View recent log entries
openclaw logs --follow --limit 100
9.2 HTTPS Encryption
The Dashboard serves over HTTP, with Tokens transmitted in plaintext during transit. Any non-local access must use HTTPS. The simplest methods are Caddy (automatic TLS) or Nginx + Let's Encrypt.
# Caddy automatic HTTPS (simplest config)
# /etc/caddy/Caddyfile
dashboard.yourdomain.com {
  reverse_proxy 127.0.0.1:18789
}

# Nginx + Let's Encrypt
# /etc/nginx/sites-available/openclaw-dashboard
server {
  listen 443 ssl http2;
  server_name dashboard.yourdomain.com;

  ssl_certificate /etc/letsencrypt/live/dashboard.yourdomain.com/fullchain.pem;
  ssl_certificate_key /etc/letsencrypt/live/dashboard.yourdomain.com/privkey.pem;

  location / {
    proxy_pass http://127.0.0.1:18789;
    proxy_http_version 1.1;
    proxy_set_header Upgrade $http_upgrade;
    proxy_set_header Connection "upgrade";
    proxy_set_header Host $host;
    proxy_set_header X-Real-IP $remote_addr;
    proxy_read_timeout 3600s;
  }
}
9.3 Access Control
- allowedOrigins: Restrict which domain origins can access the Dashboard
- IP whitelist: Configured at the reverse proxy layer, allowing only specific IP ranges
- Rate Limiting: Limit request frequency per IP to prevent Token brute-forcing
- Read-only mode: Enable
dashboard_readonlyfor non-admins to prevent accidental changes
# Set up Rate Limiting in Nginx
limit_req_zone $binary_remote_addr zone=dashboard:10m rate=10r/s;

server {
  location / {
    limit_req zone=dashboard burst=20 nodelay;
    proxy_pass http://127.0.0.1:18789;
  }
}

# Set up IP whitelist in Nginx
location / {
  allow 10.0.0.0/8;       # Internal network
  allow 100.64.0.0/10;    # Tailscale
  deny all;
  proxy_pass http://127.0.0.1:18789;
}
X. Troubleshooting
Below are the most commonly encountered Dashboard Web UI issues and their solutions.[8]
10.1 Dashboard Won't Open
Symptom: Browser shows "Unable to connect" or "ERR_CONNECTION_REFUSED"
# Troubleshooting Step 1: Confirm Gateway is running
openclaw gateway status

# Troubleshooting Step 2: Confirm Gateway's listening address and port
ss -tlnp | grep 18789
# Should show 127.0.0.1:18789 LISTEN

# Troubleshooting Step 3: Confirm Dashboard is not disabled
openclaw config get gateway.auth.dashboard_enabled
# Should show true

# Troubleshooting Step 4: Test HTTP endpoint directly
curl -v http://127.0.0.1:18789/health

# Common cause: Gateway started with --headless and dashboard_enabled is false
# Fix:
openclaw config set gateway.auth.dashboard_enabled true
openclaw gateway restart
10.2 Token Authentication Failure
Symptom: Dashboard login page shows "Invalid Token" or "Authentication Failed"
# Troubleshooting Step 1: Confirm Token is correct
openclaw config get gateway.auth.token

# Troubleshooting Step 2: Confirm browser isn't caching an old session
# Clear browser cookies and refresh

# Troubleshooting Step 3: Regenerate Token
openclaw doctor --generate-gateway-token --force
# Copy new Token and re-enter on Dashboard login page
10.3 WebSocket Disconnection During Remote Access
Symptom: Dashboard page opens but real-time data doesn't update, or frequently shows "Connection Lost"
# Most common cause: Reverse proxy not properly configured for WebSocket forwarding

# Nginx fix: Ensure Upgrade headers are properly passed
location / {
  proxy_pass http://127.0.0.1:18789;
  proxy_http_version 1.1;
  proxy_set_header Upgrade $http_upgrade;
  proxy_set_header Connection "upgrade";
  proxy_read_timeout 3600s;  # Important: at least 1 hour
  proxy_send_timeout 3600s;
}

# Cloudflare limitation: Free plan WebSocket connections have 100-second idle timeout
# Solution: Set heartbeat interval in Gateway config
openclaw config set gateway.websocket.ping_interval 30
10.4 CORS Errors
Symptom: Browser developer tools show Access-Control-Allow-Origin related errors
# Confirm allowedOrigins includes the correct domain
openclaw config get gateway.allowed_origins

# Fix: Add your access domain
openclaw config set gateway.allowed_origins \
'["https://dashboard.yourdomain.com"]'

openclaw gateway restart
10.5 Dashboard Shows Blank Page
Symptom: Browser can connect but page is blank, developer tools show JavaScript errors
# Troubleshooting Step 1: Clear browser cache
# Press Ctrl+Shift+R (Windows/Linux) or Cmd+Shift+R (macOS) to force refresh

# Troubleshooting Step 2: Confirm OpenClaw version
openclaw --version
# Dashboard frontend may be incompatible with Gateway version
# Ensure both are the same version

# Troubleshooting Step 3: Update OpenClaw
curl -fsSL https://openclaw.ai/install.sh | bash
openclaw gateway restart
Conclusion
OpenClaw's graphical operation capabilities, from the Gateway Dashboard Web UI to desktop integrations, represent an important design philosophy: powerful tools shouldn't belong only to those who can write code. CLI is the efficiency weapon for developers, but Web UI is the key bridge for AI agents to reach the entire organization.[7]
The operation paths covered in this article can be summarized in three progressive levels:
- Level 1: Local Dashboard --
openclaw dashboardopens the browser management interface with one click, zero additional setup, suitable for individual users to get started quickly - Level 2: Secure Remote Access -- Tailscale / SSH Tunnel / Cloudflare Tunnel lets you manage the remote Gateway from any device, suitable for distributed teams
- Level 3: Enterprise-Grade GUI Deployment -- Combined with OpenWebUI, custom frontends, Zero Trust authentication, and role permission controls, providing the entire organization with an operation experience approaching commercial SaaS
Which level to choose depends on your specific needs. An individual developer may only need Level 1; a 5-person remote team suits Level 2; while an enterprise needing marketing, sales, and HR departments to all use AI agents requires the full Level 3 deployment.[6]
As the OpenClaw community continues to grow, Dashboard features are also rapidly iterating.[2] Future improvements to look forward to include more complete team collaboration features, finer RBAC permission models, a built-in Agent template marketplace, and native mobile applications. We recommend staying up-to-date with the official configuration documentation and community discussions to keep pace with the latest graphical operation capabilities.[1]